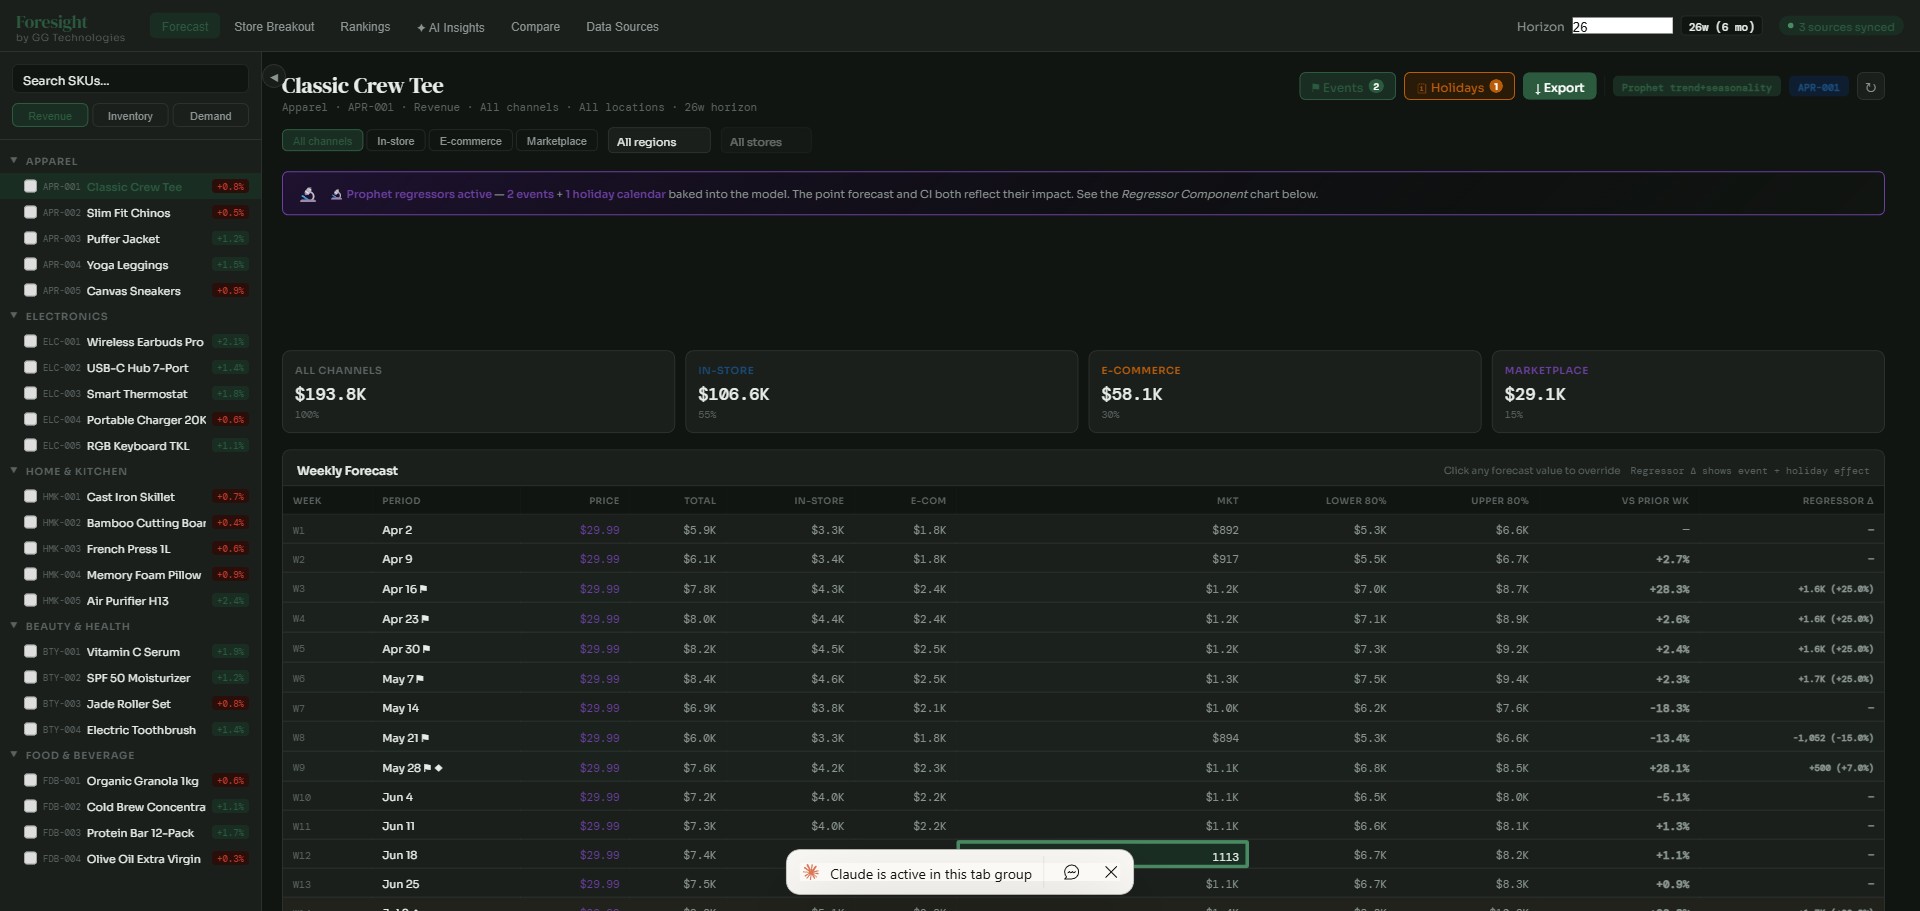
Full P&L Forecasting
Get 26-week demand forecasts for every individual product with a complete P&L view — price, inventory, cost, margin, revenue, and demand — all in one weekly forecast table. Click any value to override it.
- ✓ Weekly P&L table: price, inventory, cost, margin, revenue, demand
- ✓ 80% confidence intervals with editable forecast overrides
- ✓ Channel breakdowns: in-store, e-commerce, marketplace
- ✓ Trend and seasonality component decomposition
- ✓ Region and store-level filtering with export
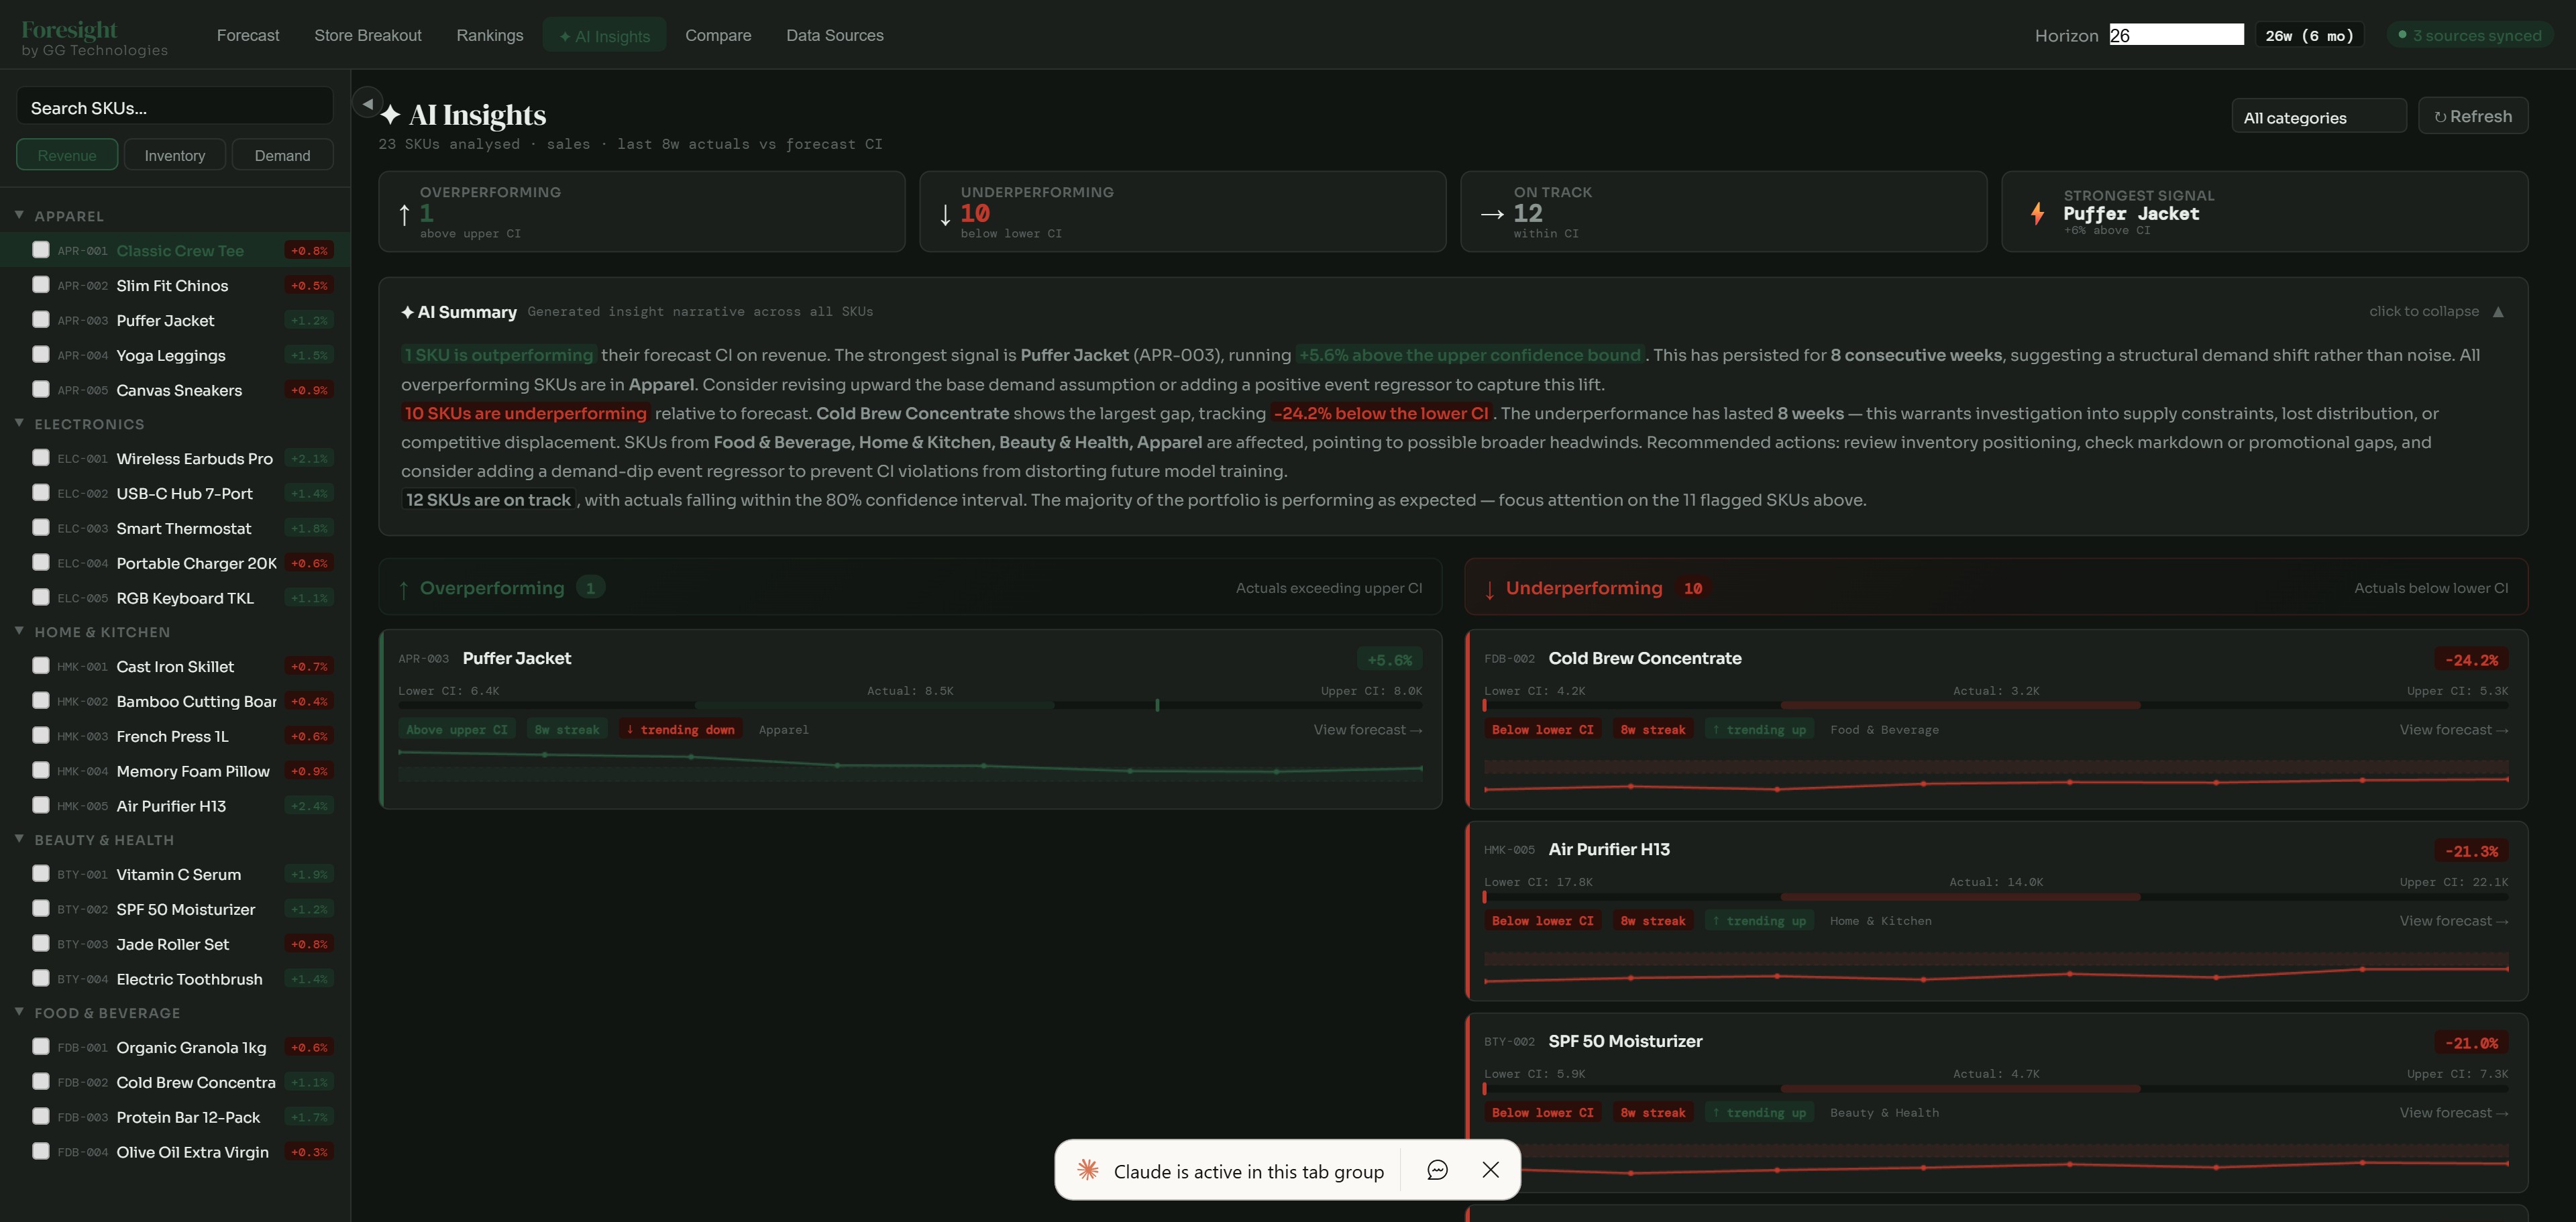
AI-Powered Insights
Get a full portfolio-level AI summary that classifies every SKU as overperforming, underperforming, or on track — with plain-English narratives, event impact analysis, and actionable recommendations.
- ✓ Portfolio-wide AI summary with overperforming/underperforming classification
- ✓ Strongest signal detection and performance streak tracking
- ✓ Event and holiday impact analysis across all SKUs
- ✓ Manual override tracking with confidence interval bounds
- ✓ Category filtering and one-click refresh
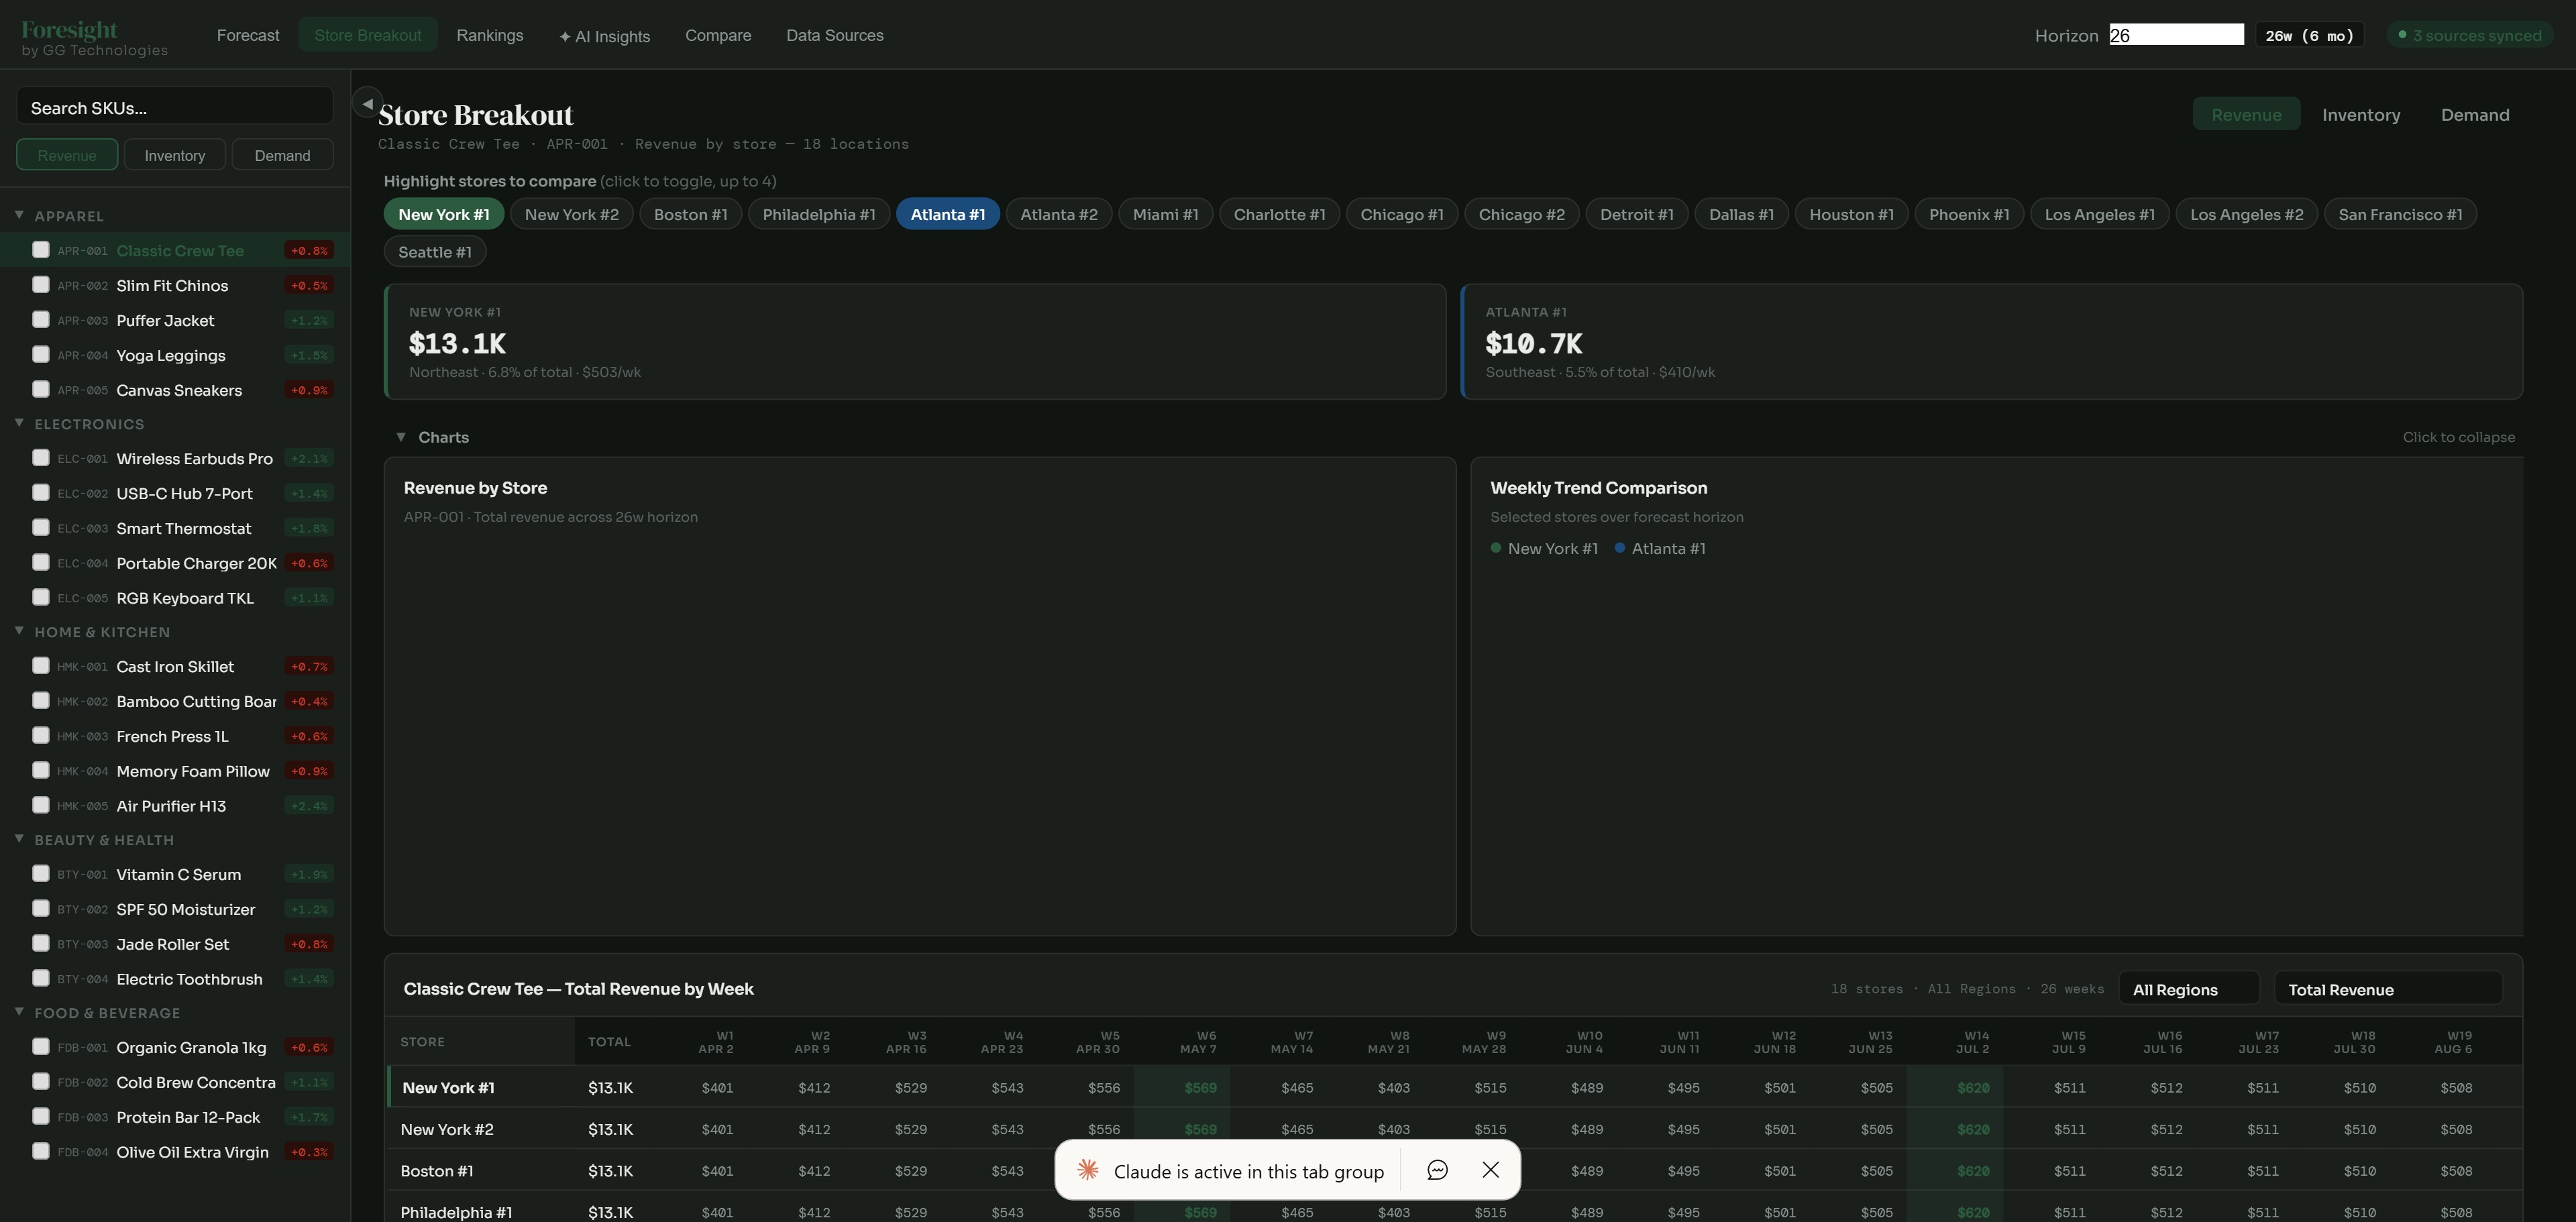
Store-Level Breakout
Compare revenue, inventory, and demand across 18+ store locations organized by region. Toggle between metrics, highlight up to 4 stores for side-by-side comparison, and drill into weekly trends.
- ✓ 18+ locations across multiple regions and markets
- ✓ Revenue, inventory, and demand metric tabs
- ✓ Revenue by Store bar chart and Weekly Trend Comparison
- ✓ Regional grouping: Country, Region, Market, Store
- ✓ Weekly granularity with per-store revenue and averages
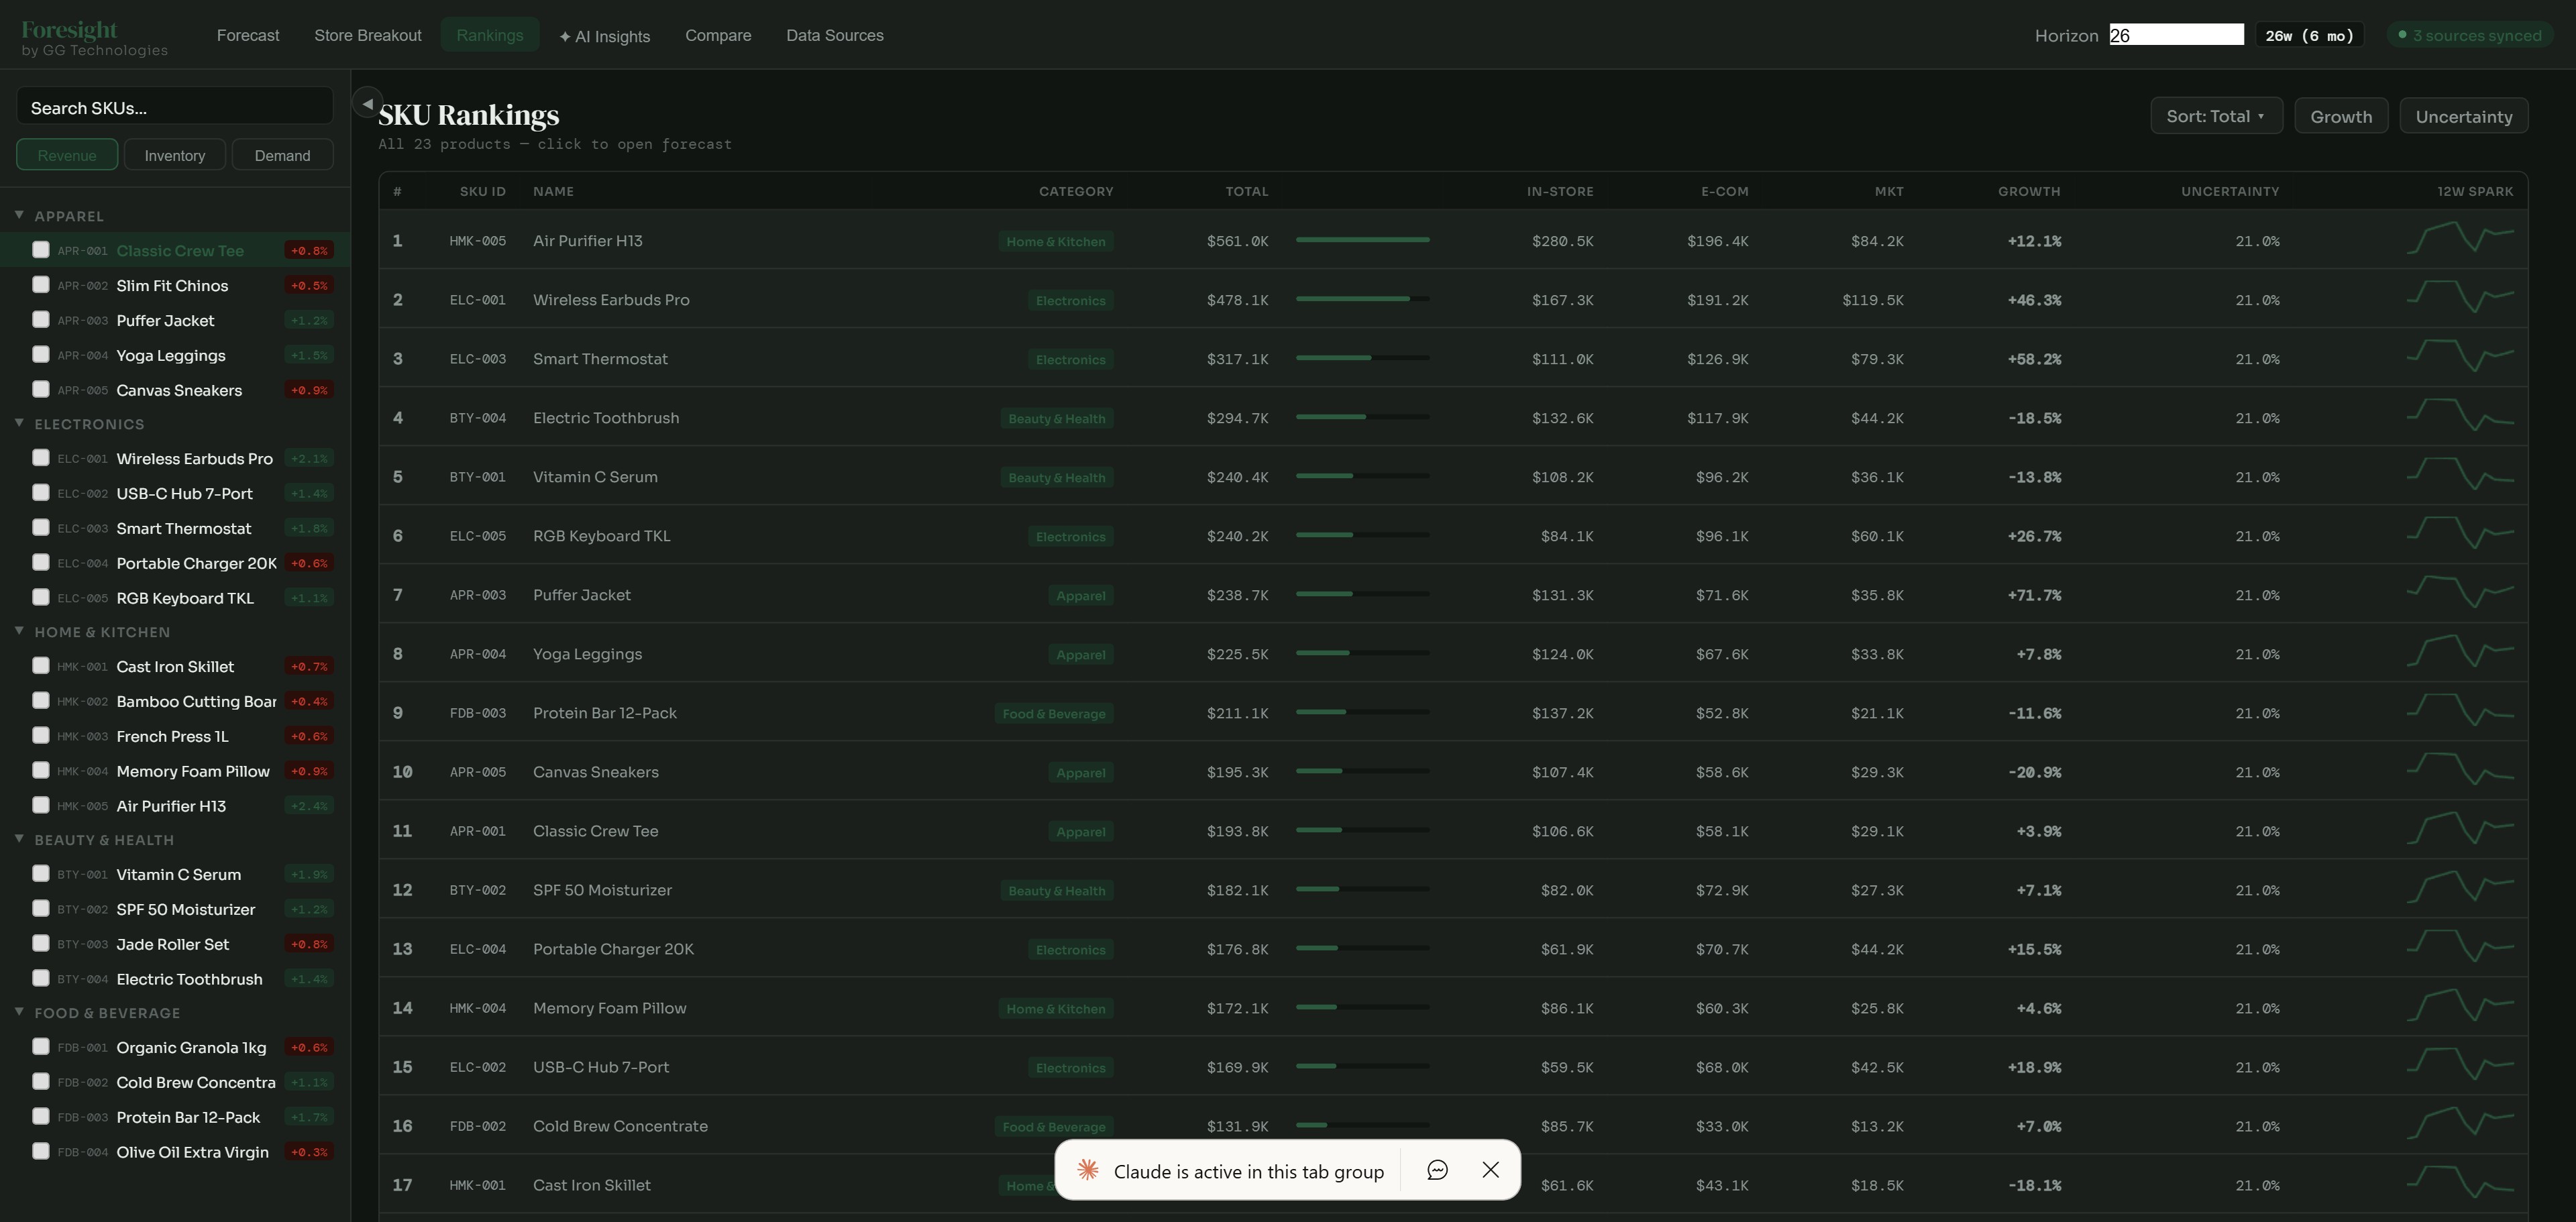
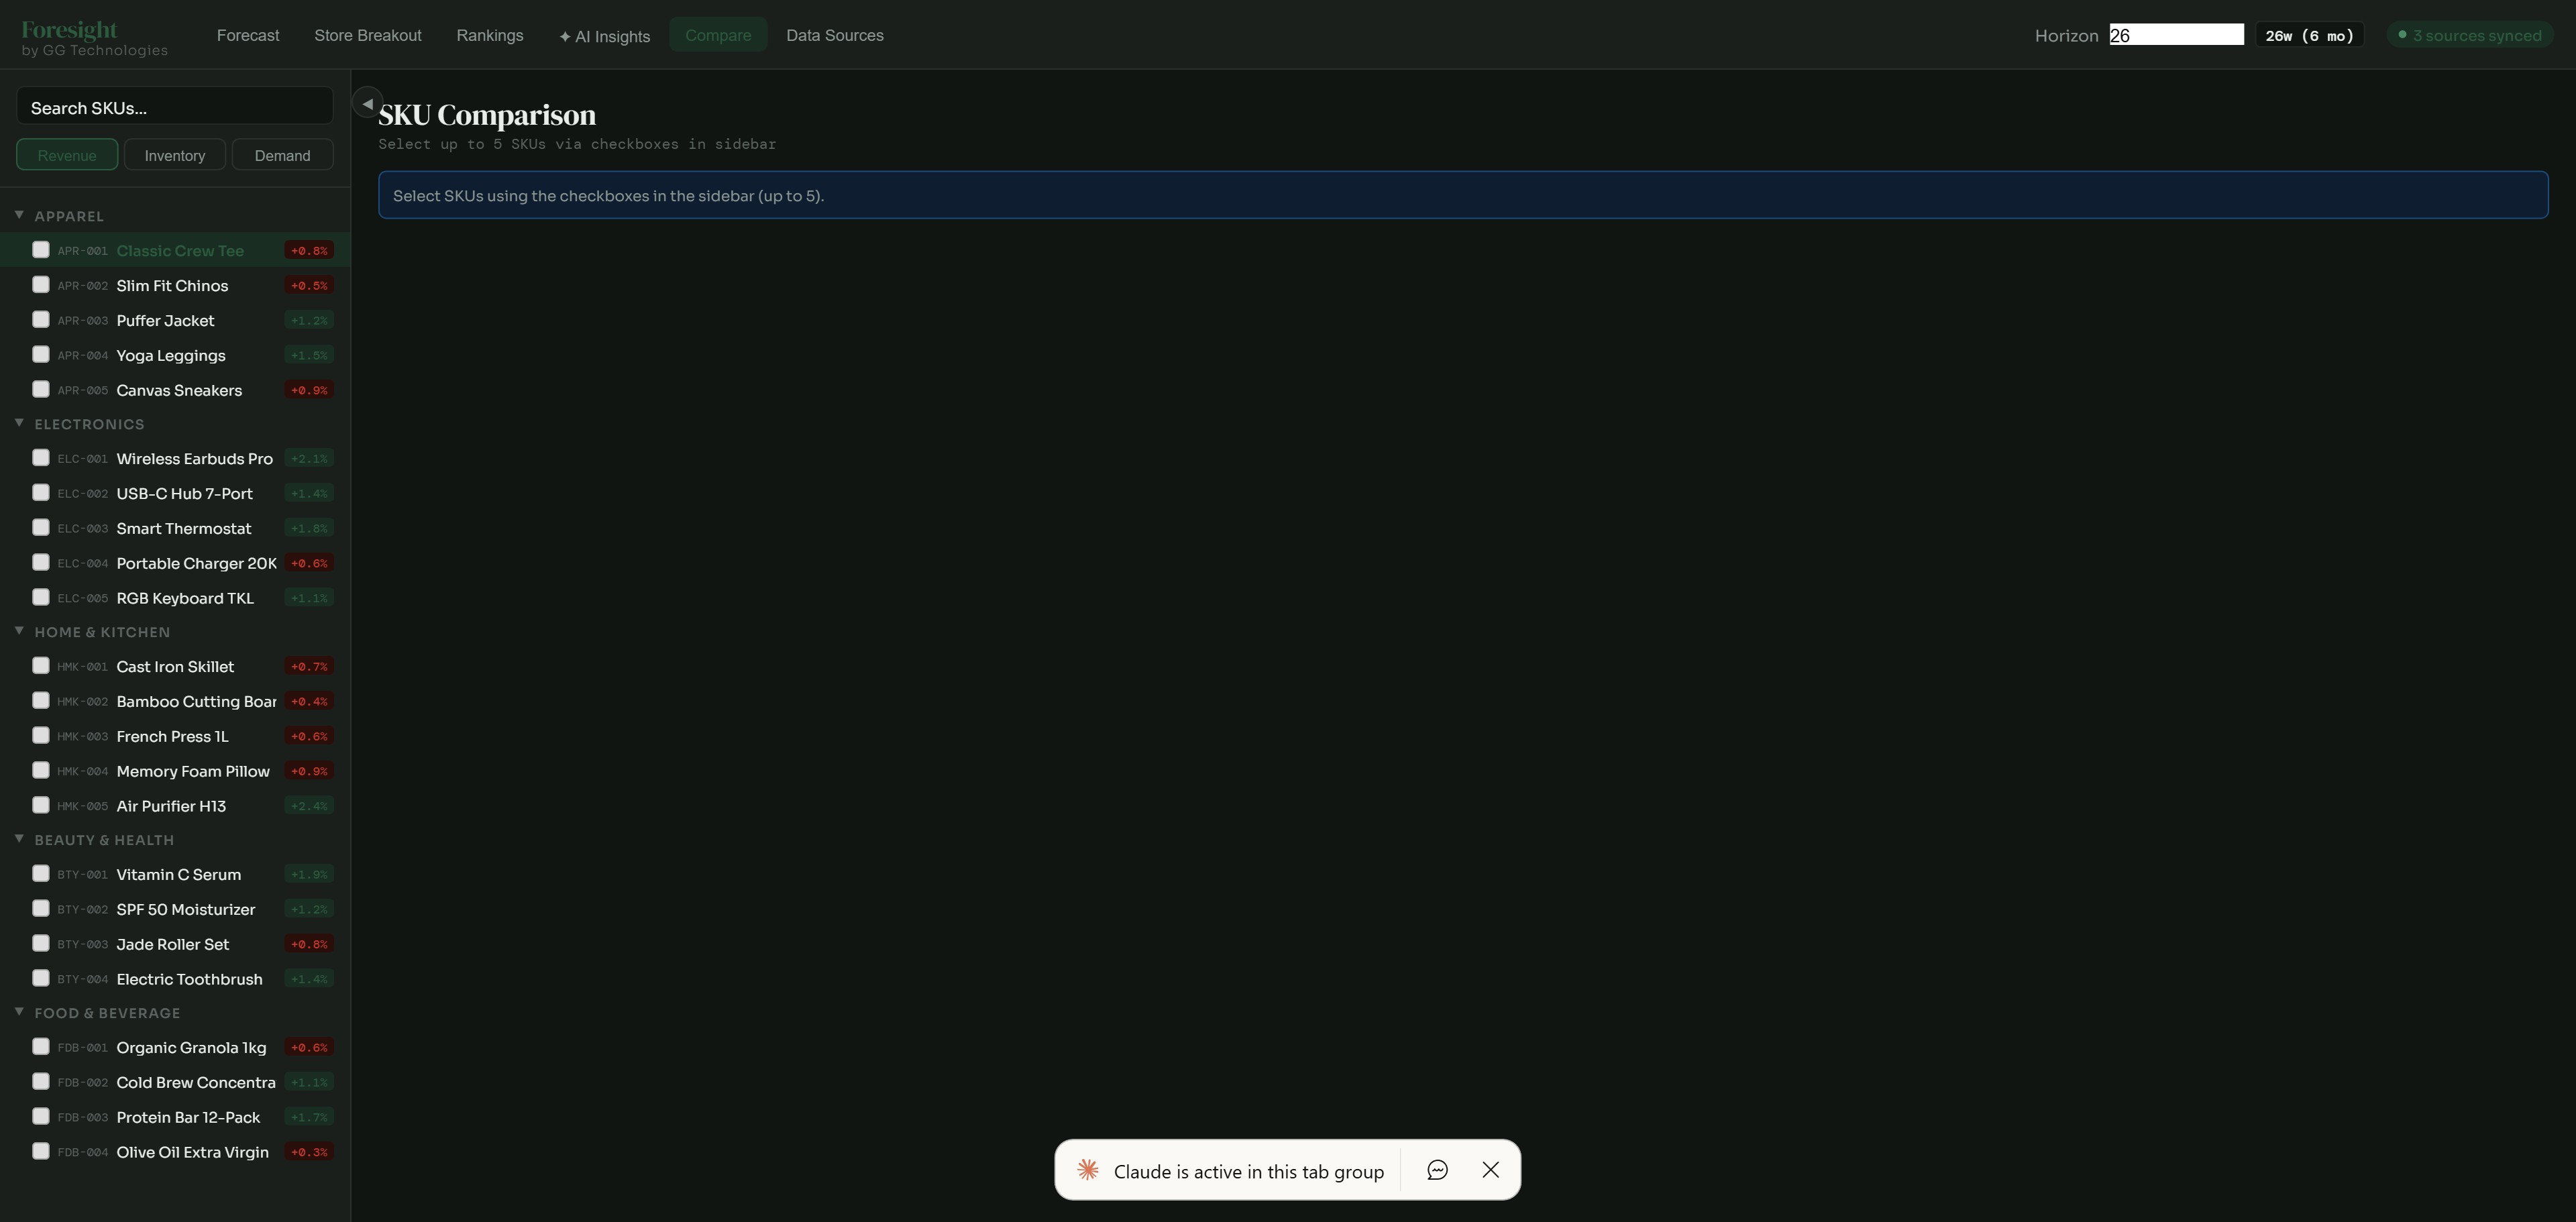
Rankings & Portfolio View
See all 23+ SKUs across 5 categories ranked at a glance. Sort by total revenue, growth rate, or forecast uncertainty with channel-level breakdowns for every product.
- ✓ Sort by total revenue, growth, or uncertainty
- ✓ Channel columns: In-Store, E-Commerce, Marketplace
- ✓ 5 category tags: Apparel, Electronics, Home & Kitchen, Beauty & Health, Food & Beverage
- ✓ 12-week sparkline trends with growth percentages
- ✓ One-click drill-down to full forecast
Event & Holiday Regressors
Events and holidays are baked directly into your Prophet models. See their isolated impact on the Regressor Component chart and track how they shift your forecast and confidence intervals.
- ✓ Built-in US holiday calendars (Memorial Day, Independence Day, Labor Day, etc.)
- ✓ Custom event creation with per-SKU impact tracking
- ✓ Regressor Component chart showing isolated event vs. holiday effects
- ✓ Regressor delta row in weekly forecast table
- ✓ Active event/holiday badges with count indicators
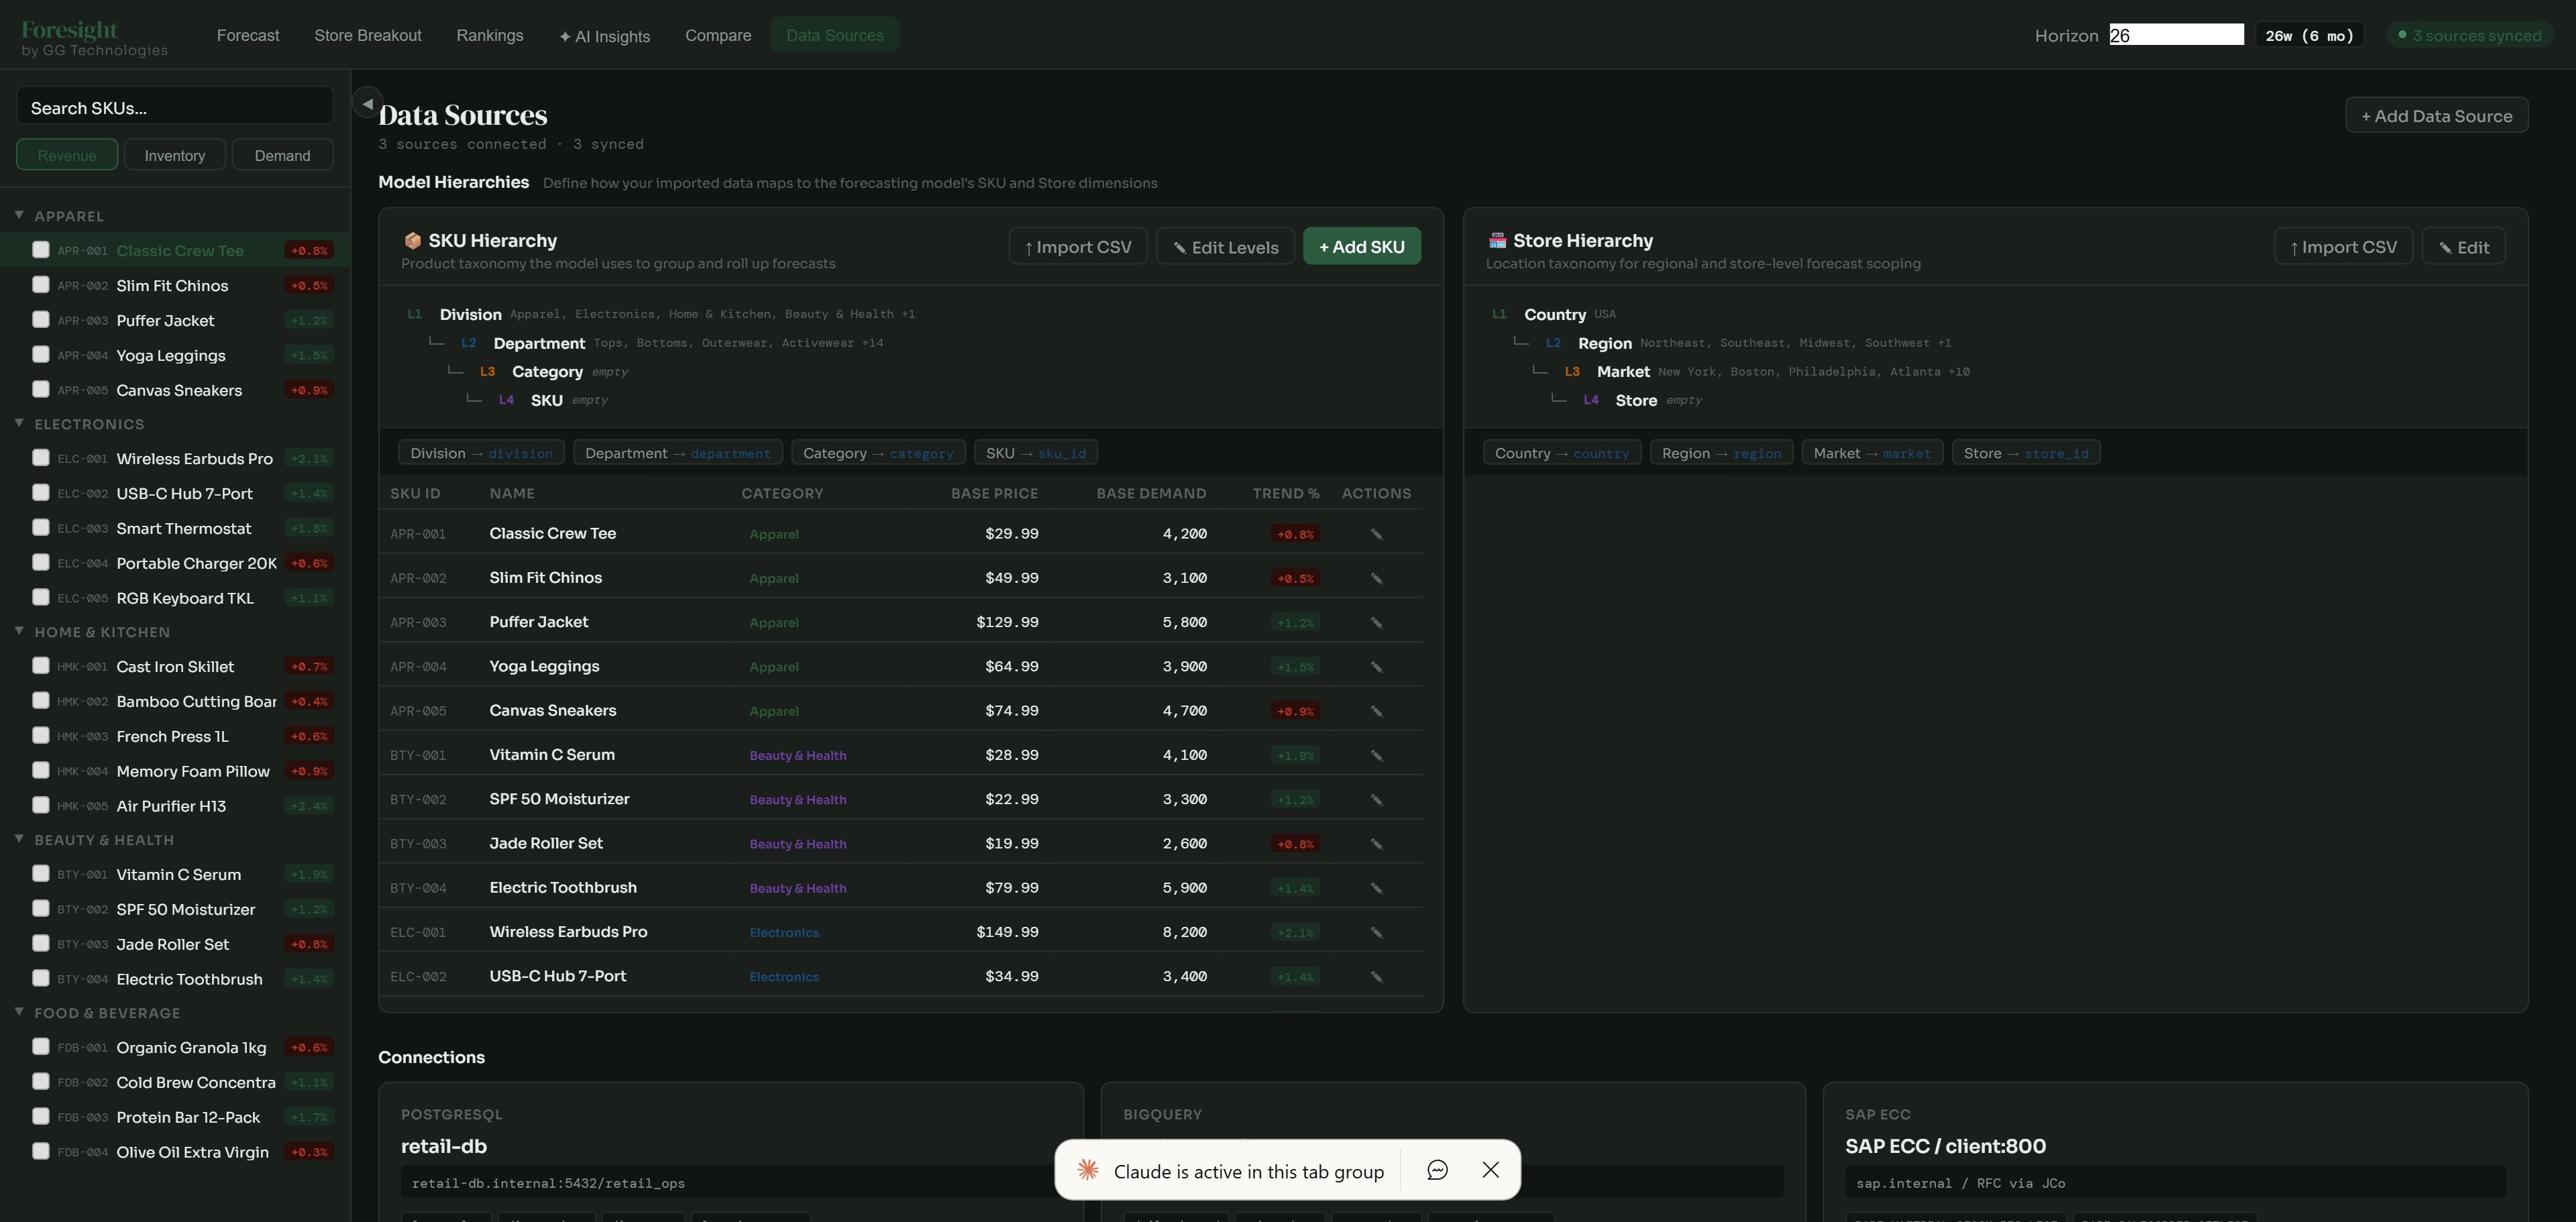
Data Source Management
Connect your sales data and define your model hierarchies. Foresight supports multi-level SKU taxonomies (Division, Department, Category, SKU) and store hierarchies (Country, Region, Market, Store) for organized forecasting at any level.
- ✓ SKU Hierarchy: Division, Department, Category, SKU with CSV import
- ✓ Store Hierarchy: Country, Region, Market, Store with editable levels
- ✓ Add SKUs with base price, base demand, and trend data
- ✓ 3 source connectors with real-time sync status
- ✓ CSV import and inline editing for both hierarchies